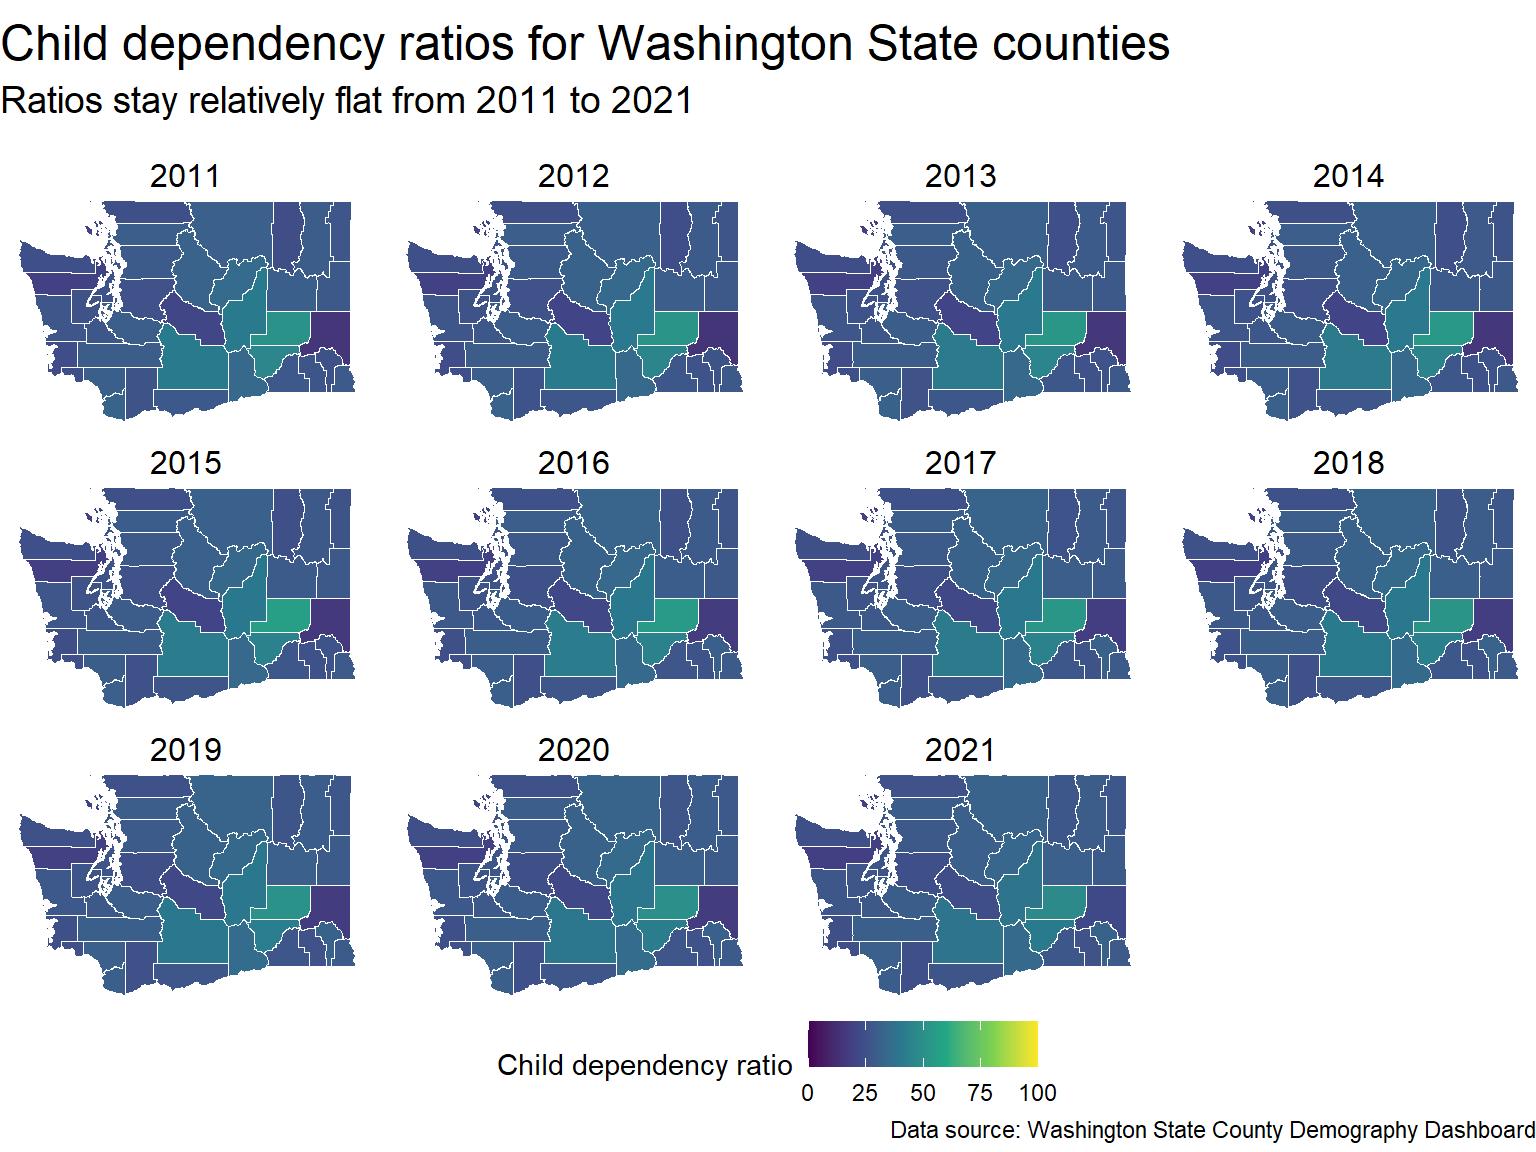
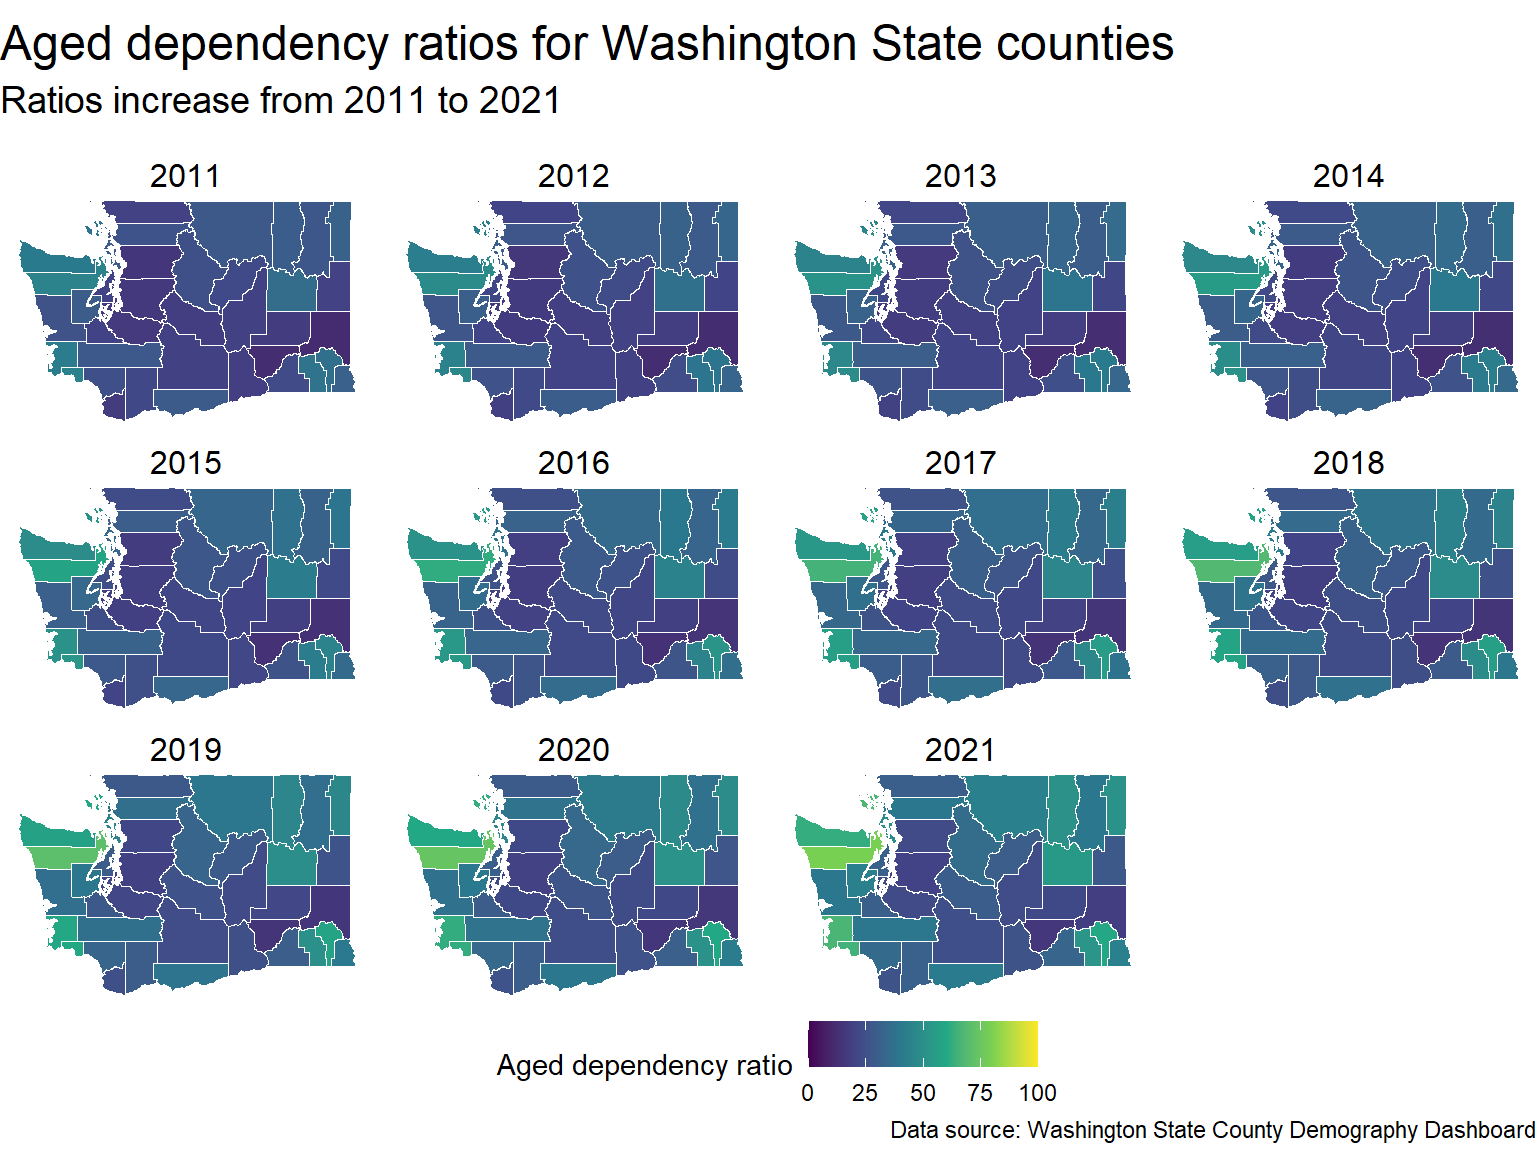
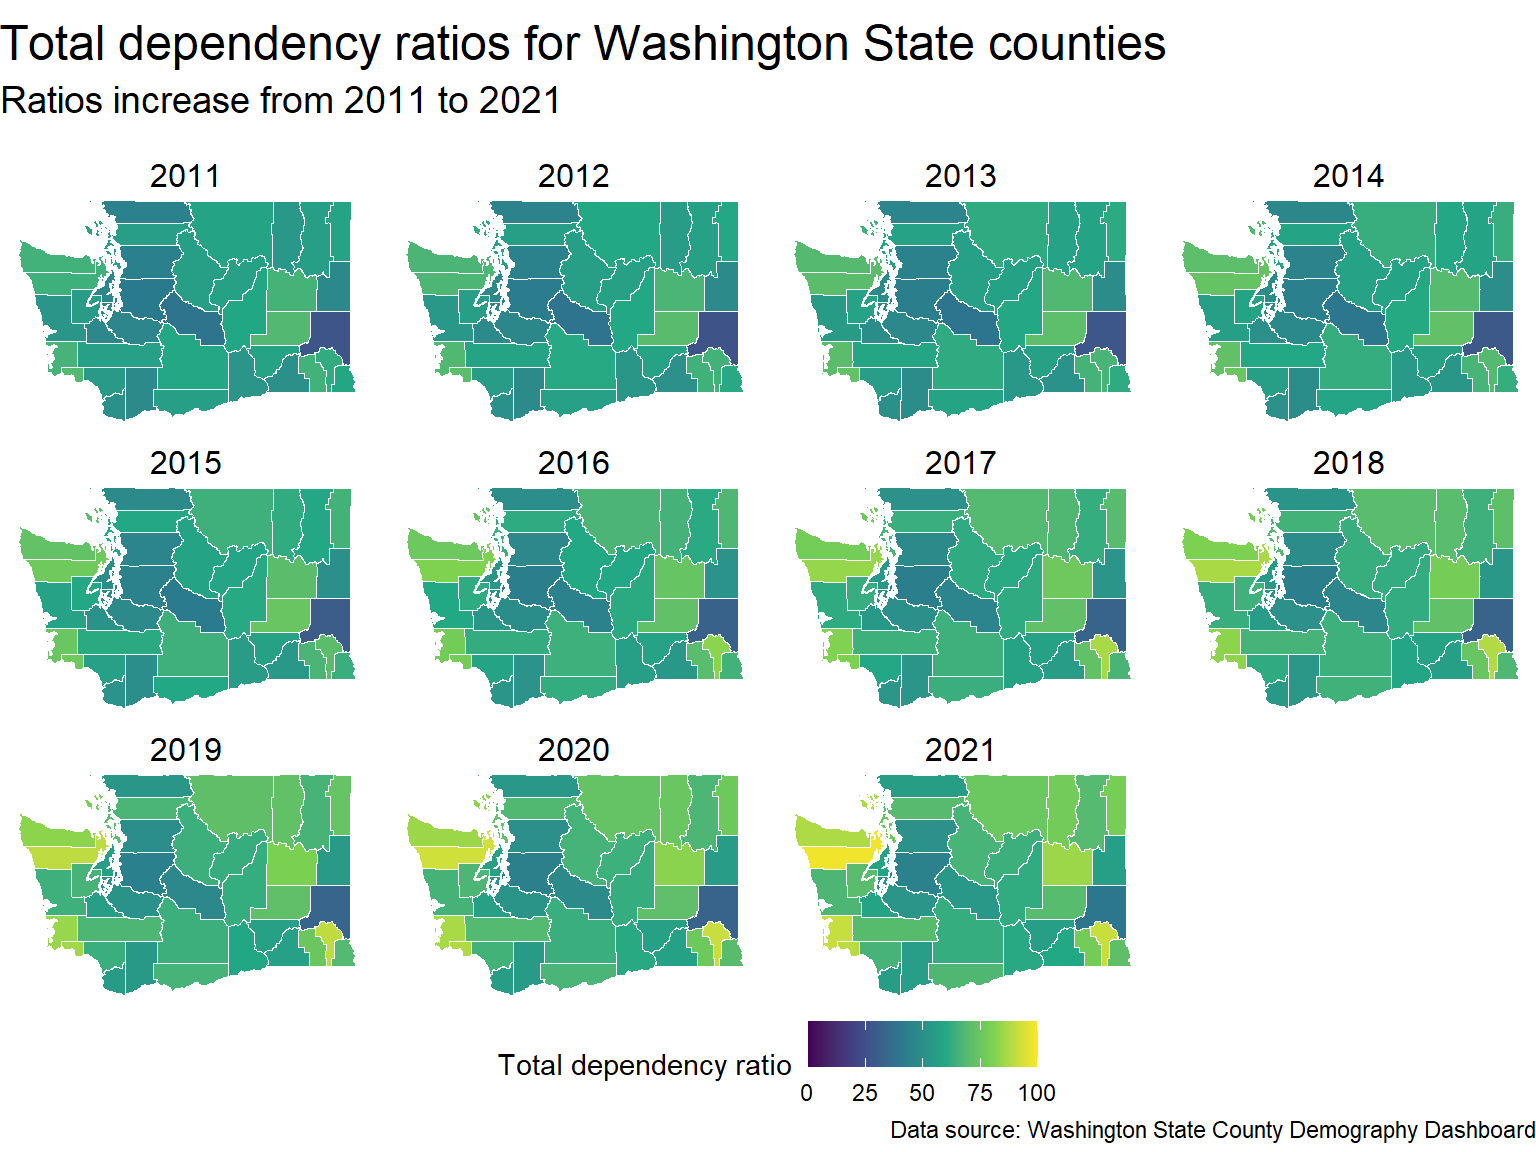
Overall, dependency rations are increasing from 2011 to 2021 in Washington State. This is driven primarily by a strong upward trend in the aged dependency ratio. The statewide child dependency ratio is declining, but with local counter trend
The following maps show how all three dependency ratios are changing across the state over time.
Show the code
base_map +geom_sf(aes(fill=child_dep_ratio), colour="white") +labs(title="Child dependency ratios for Washington State counties",subtitle=paste("Ratios stay relatively flat from", start_year, "to", last_year, "\n"),fill="Child dependency ratio" )
Show the code
base_map +geom_sf(aes(fill=aged_dep_ratio), colour="white") +labs(title="Aged dependency ratios for Washington State counties",subtitle=paste("Ratios increase from", start_year, "to", last_year, "\n"),fill="Aged dependency ratio" )
Show the code
base_map +geom_sf(aes(fill=total_dep_ratio), colour="white") +labs(title="Total dependency ratios for Washington State counties",subtitle=paste("Ratios increase from", start_year, "to", last_year, "\n"),fill="Total dependency ratio" )
Conclusions and key takeaways
There are regional differences in dependency ratios.
The highest ratios are on the Pacific coast and in the eastern quarter of the state.
Between these two regions there are distinct differences in dependency ratios with the highest rates of aged and total dependency being on the coast.
The counties with the highest total dependency ratios have rates of change 2-5 times higher than the statewide rate.
Given that the statewide total dependency ratio is increasing, the state should consider the long term impacts on revenue and services expenditures.
The counties with the highest total dependency ratios may need to consider how their population dynamics will impact the tax base.