Now that the data have been cleaned, transformed, and new features have been created, the analysis of the data can be performed. The purpose of this analysis is to understand how chronic absenteeism is changing in Colorado both spatially and temporally and what key insights can be taken from the analysis.
Absentee trends for Colorado school districts
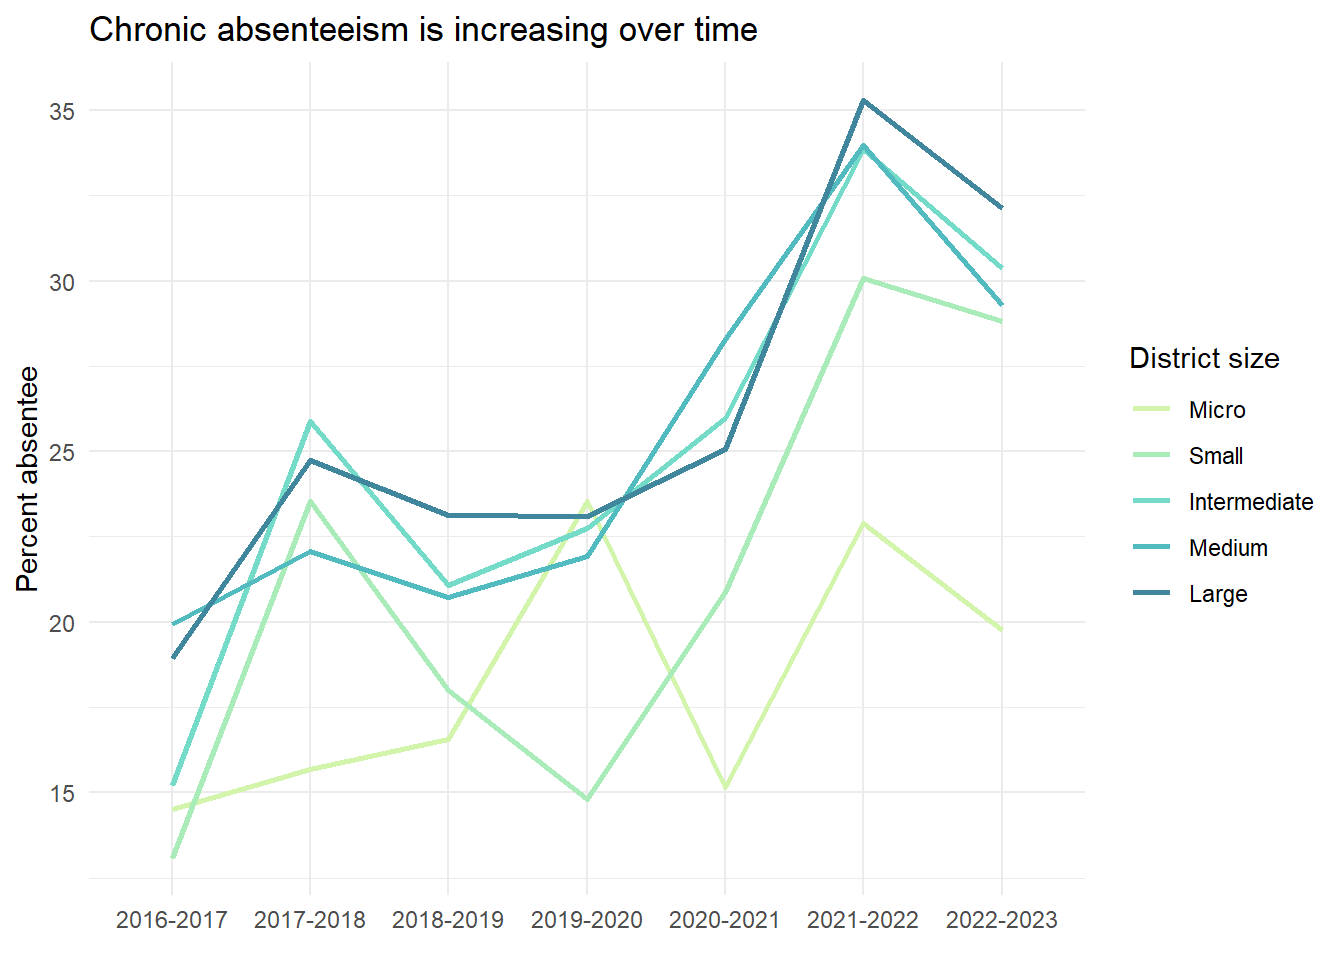
To begin, we create a line chart showing how the average chronic absenteeism changes for each district_size from 2016 - 2023. These are weighted averages that take into account the varying sizes of the individual school districts.
From this plot, we can see that, over all rates chronic absenteeism have increased for all district sizes from 2016 to 2023. There is a peak in the 2021-2022 school year, but it is too early to tell if the upward trend will continue or if 2021-2022 represents the high water mark. In addition to the overall trend, it is clear that larger districts tend to have higher rates of chronic absenteeism than smaller districts. The volatility of rate the smallest districts can be in the three school years from 2019-2022.
Spatial variations in chronic absenteeism
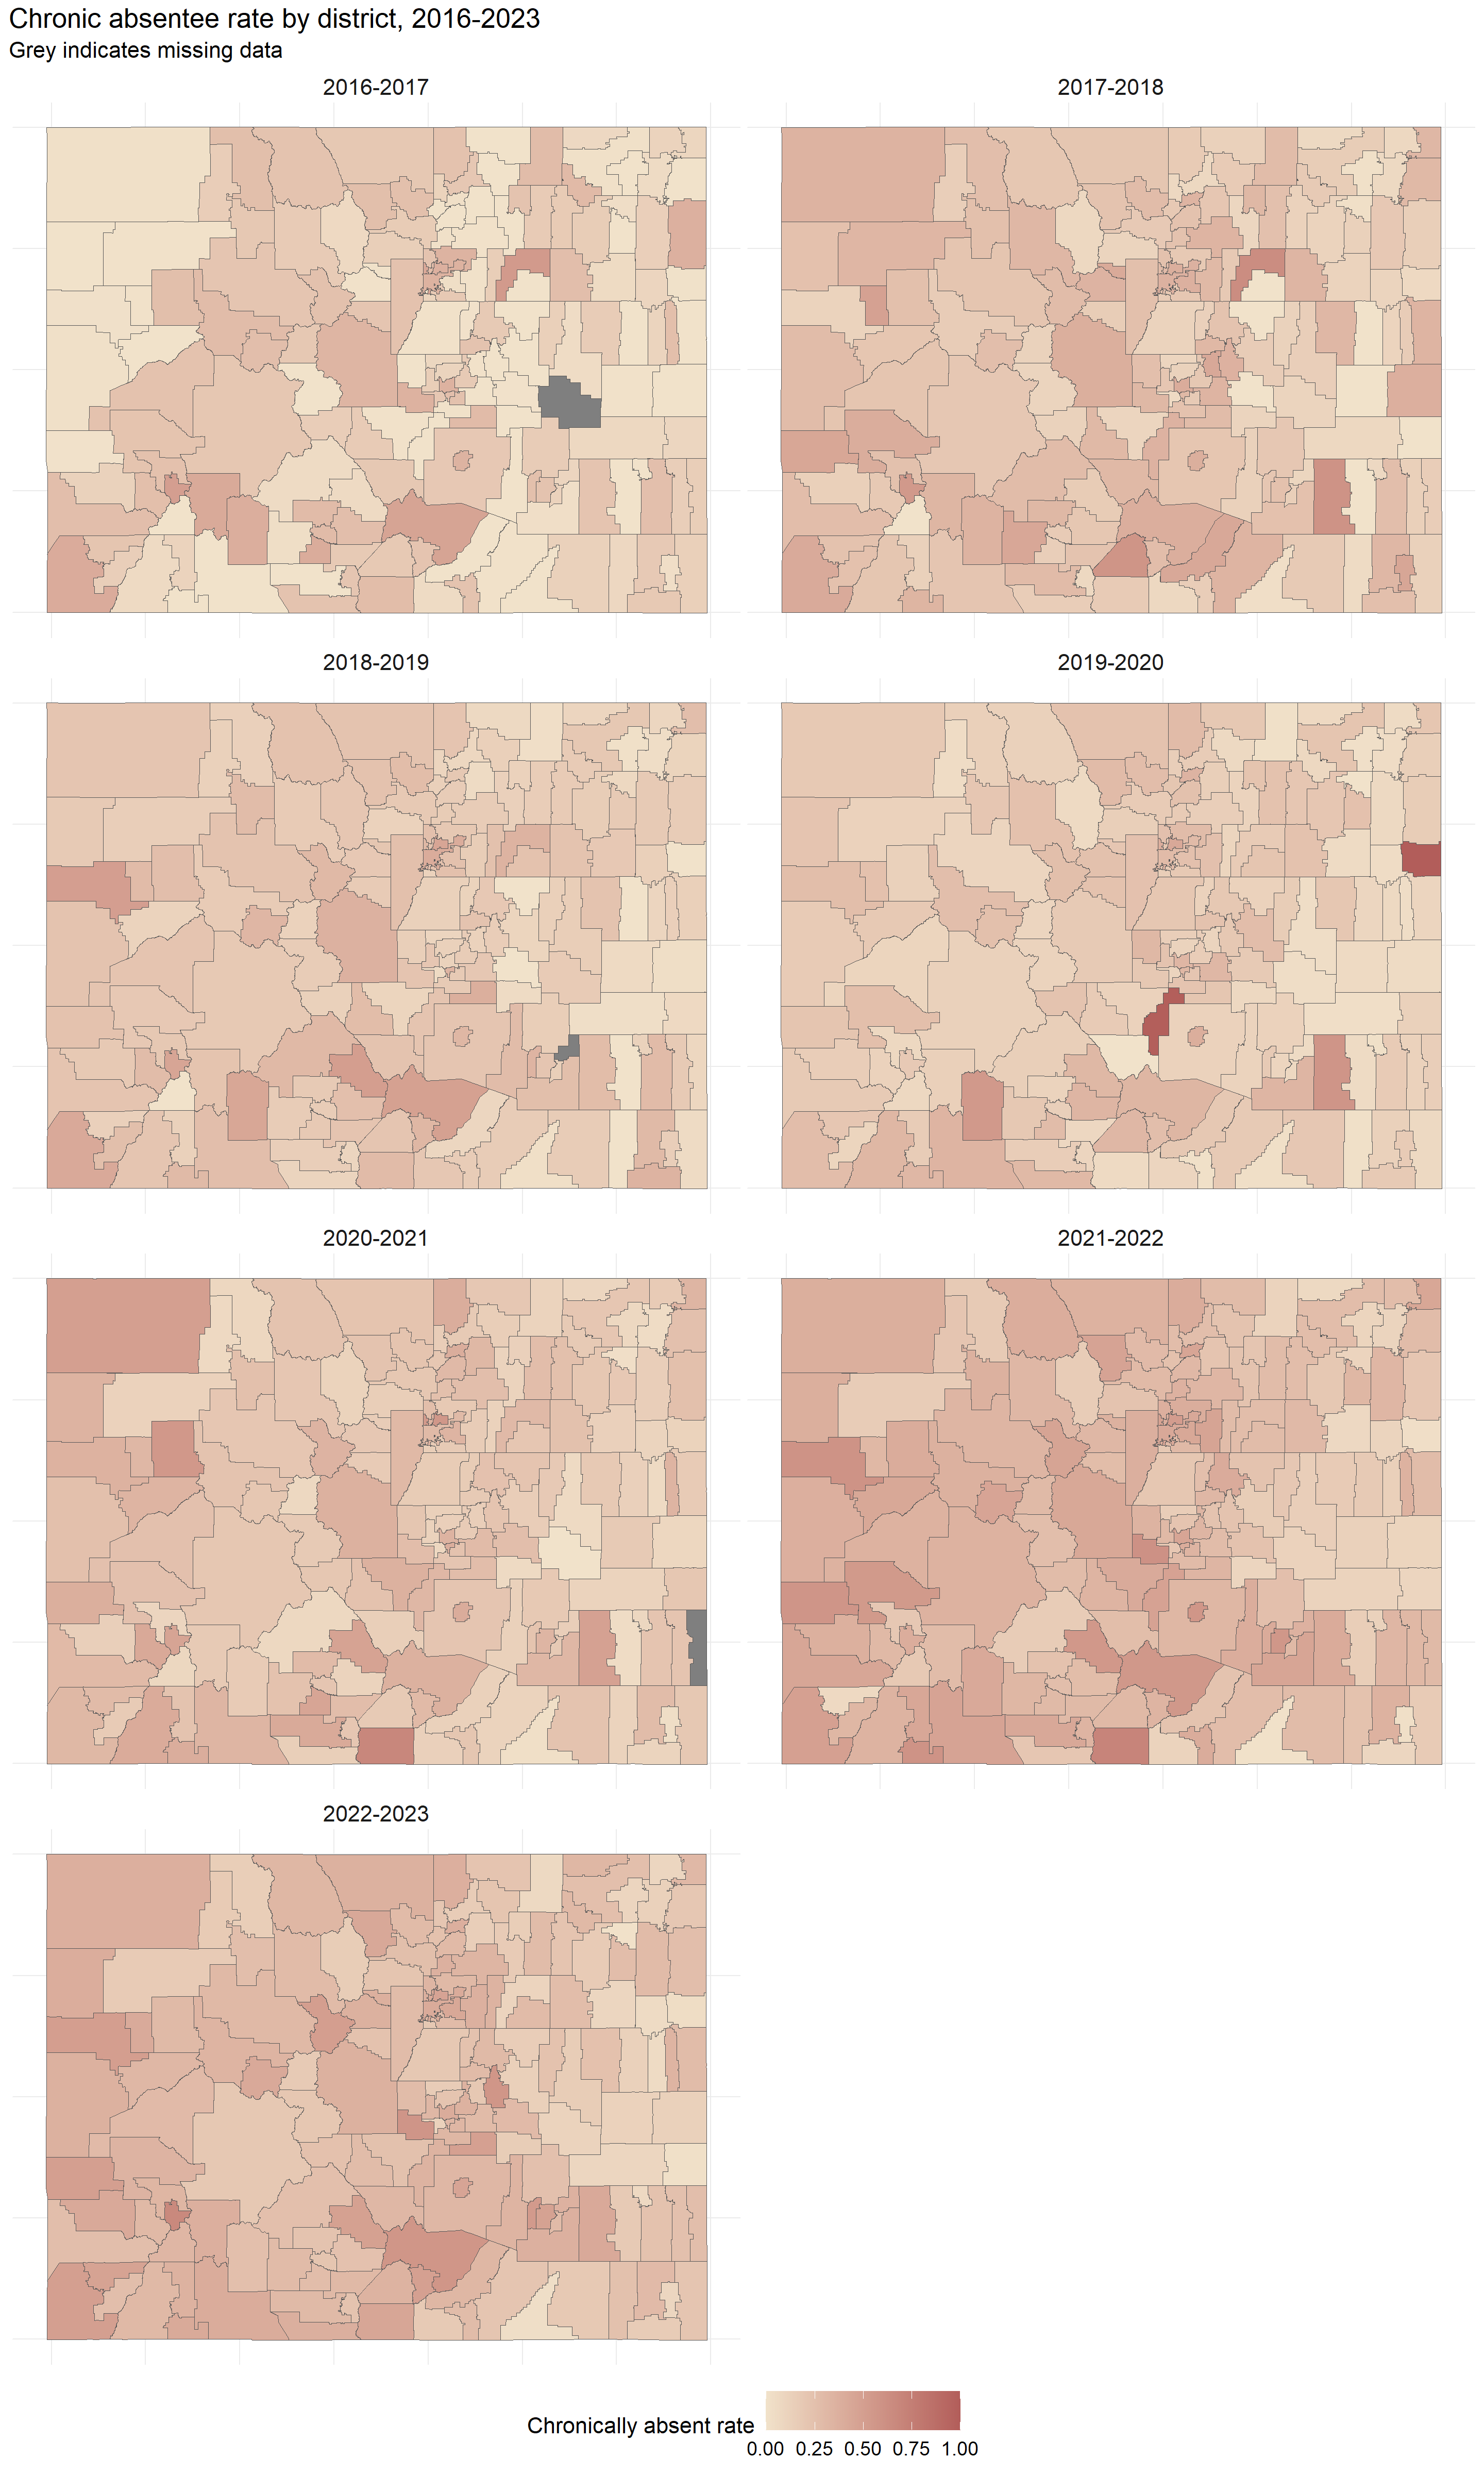
These maps show the change rates of chronic absenteeism spatially over time. The overall trend is that chronic absenteeism is increasingly a problem statewide, but local changes vary widely. The lowest rates of chronic absenteeism tend to be in the eastern part of the state, which is an ares dominated by smaller districts. The highest rates tend to be in the southern and southwestern Colorado. The main urban centres also show high rates of chronic absenteeism.
The changing rates of absenteeism show a trend of generally increasing rates peaking in the 2021-2022 school year. There is not yet enough data to know if this represents a peak in rates of absenteeism or if they will continue to climb.
Spatial variations in the change of chronic absenteeism rates
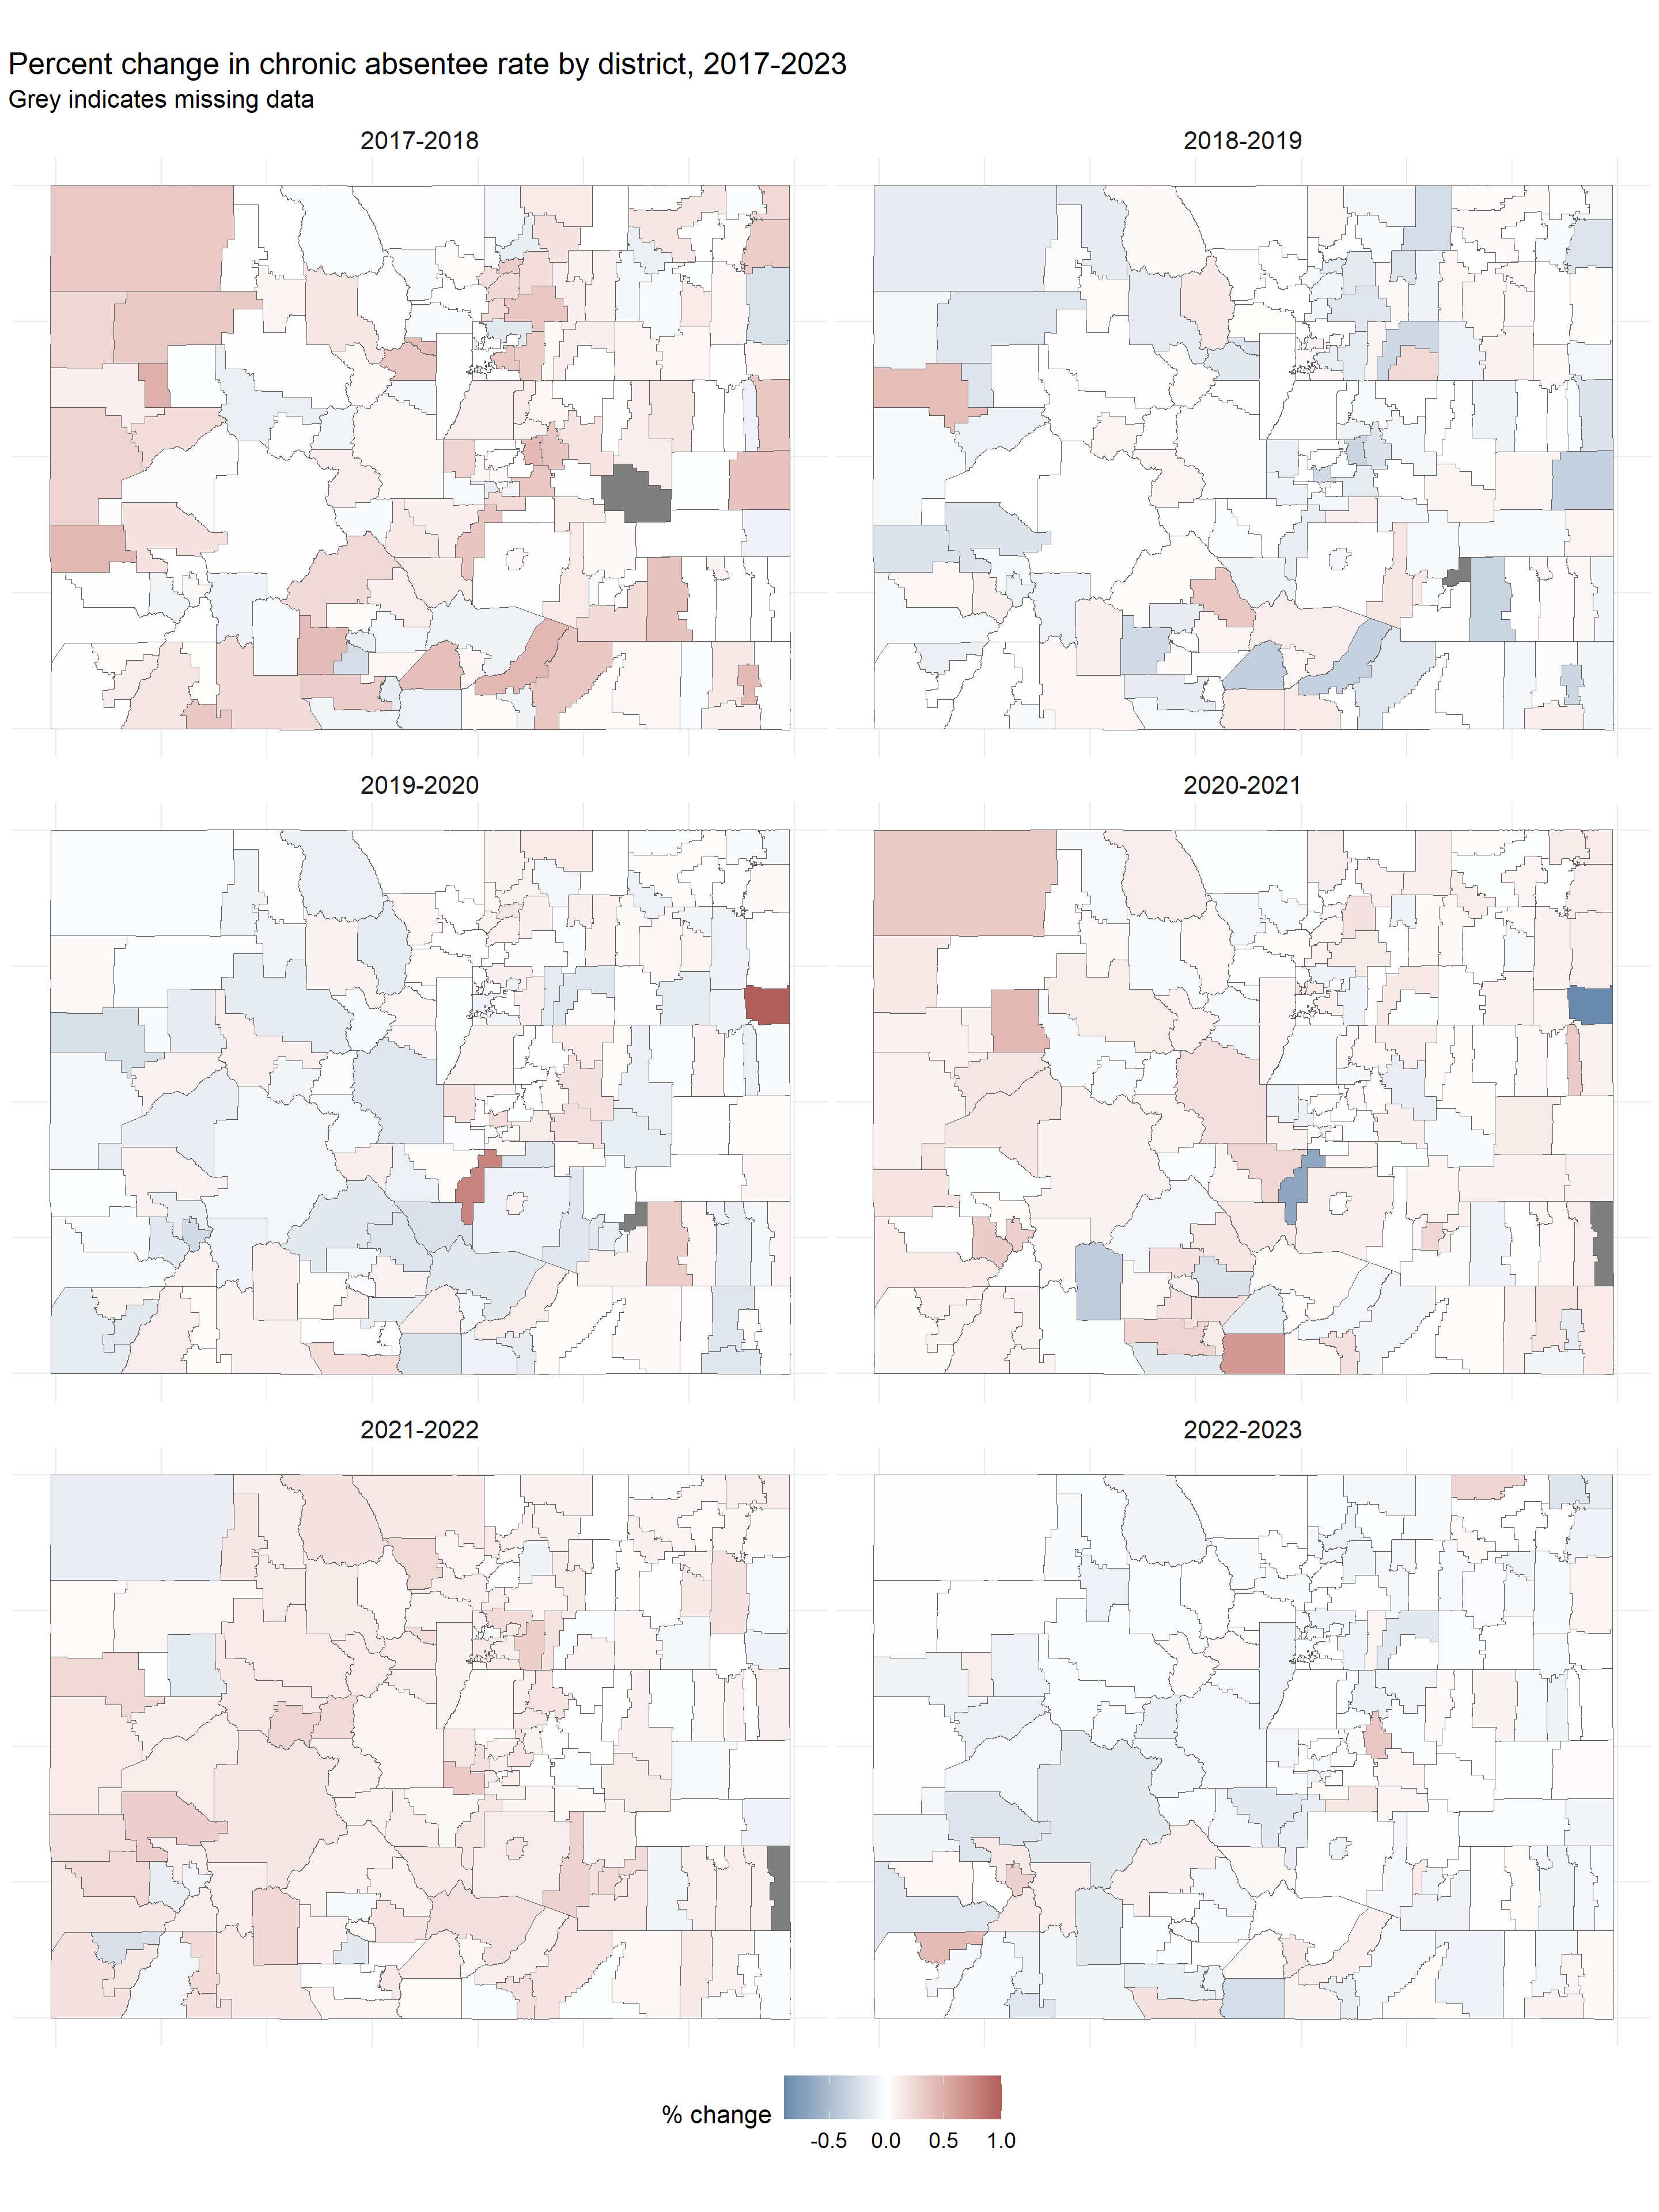
The rate of change of chronic absenteeism varies from region to region throughout the state. As expected, smaller districts show the most variability due to their smaller enrollment numbers. Early rates of change may be the result of improved record keeping on this metric rather than a real change in the rate of chronic absenteeism. This would be consistent with the relative stability of rates in 2017-2018 and 2018-2019. As expected, the rate of change increases statewide during the pandemic before appearing to improve in 2022-2023.
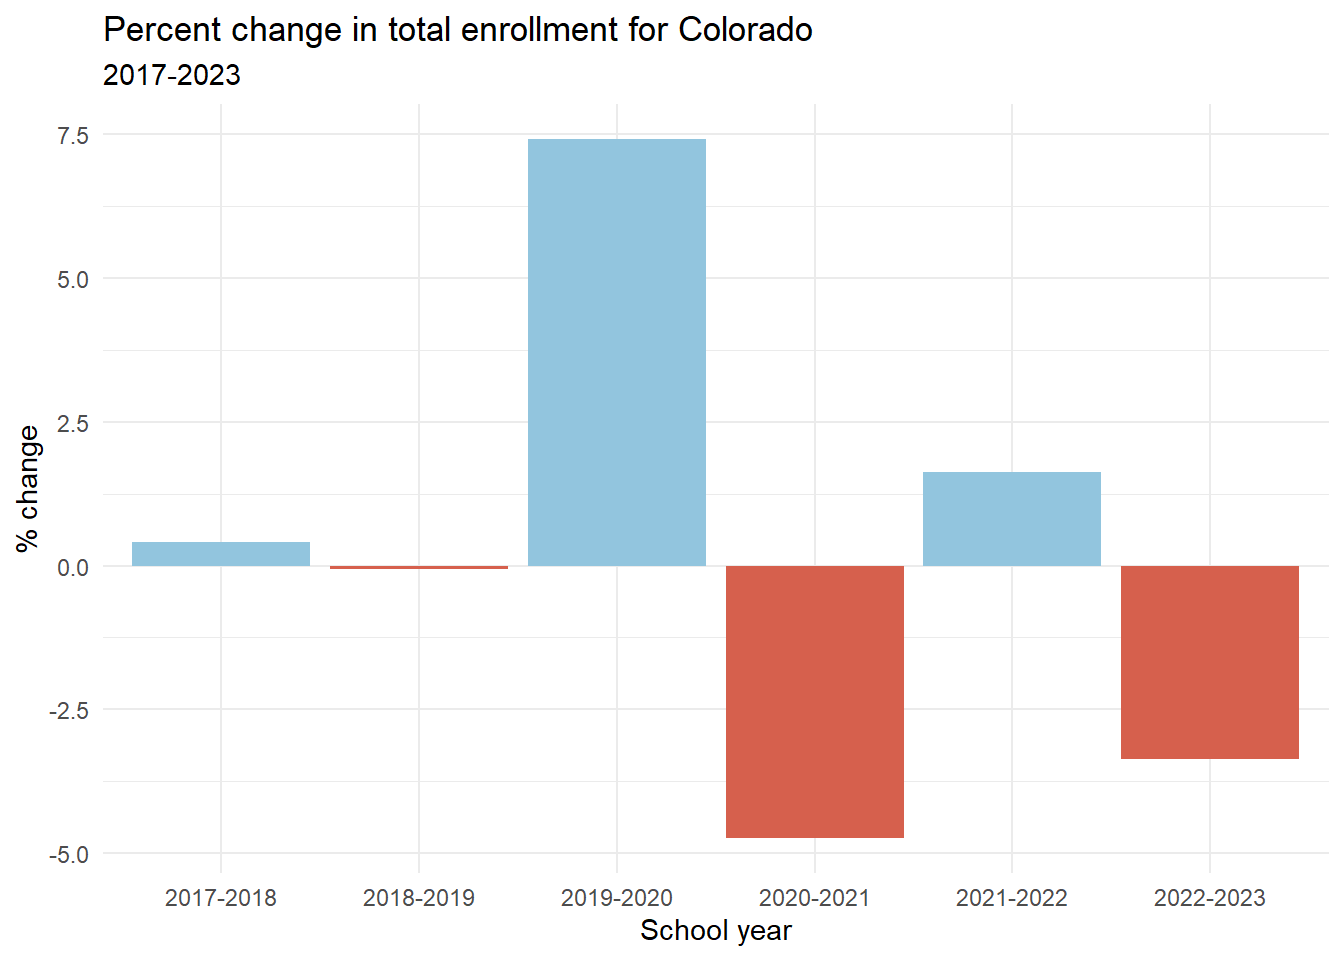
Student enrollment was stable from the 2016-2017 to 2018-2019 school year. From 2019-2020 to 2022-2023 there was significant volatility in the total enrollment numbers for Colorado, with numbers return to pre-pandemic levels in the 2022-2023 school year.
As the following plot shows, Colorado student enrollments are volatile in the 2019-2022 school years. The number of students enrolled fluctuates significantly during the time that chronic absentee rates are peaking.
total_enrollment_year |>mutate(pct_change =100*(total_enrollment -lag(total_enrollment))/lag(total_enrollment),pos =if_else(pct_change>0, TRUE, FALSE) ) |>filter(school_year !="2016-2017") |>ggplot(aes(x=school_year, y=pct_change, fill=pos)) +geom_col(position ="identity") +scale_fill_manual(values =c("#D6604D", "#92C5DE"), guide ="none") +labs(x="School year",y="% change",title="Percent change in total enrollment for Colorado",subtitle="2017-2023" )
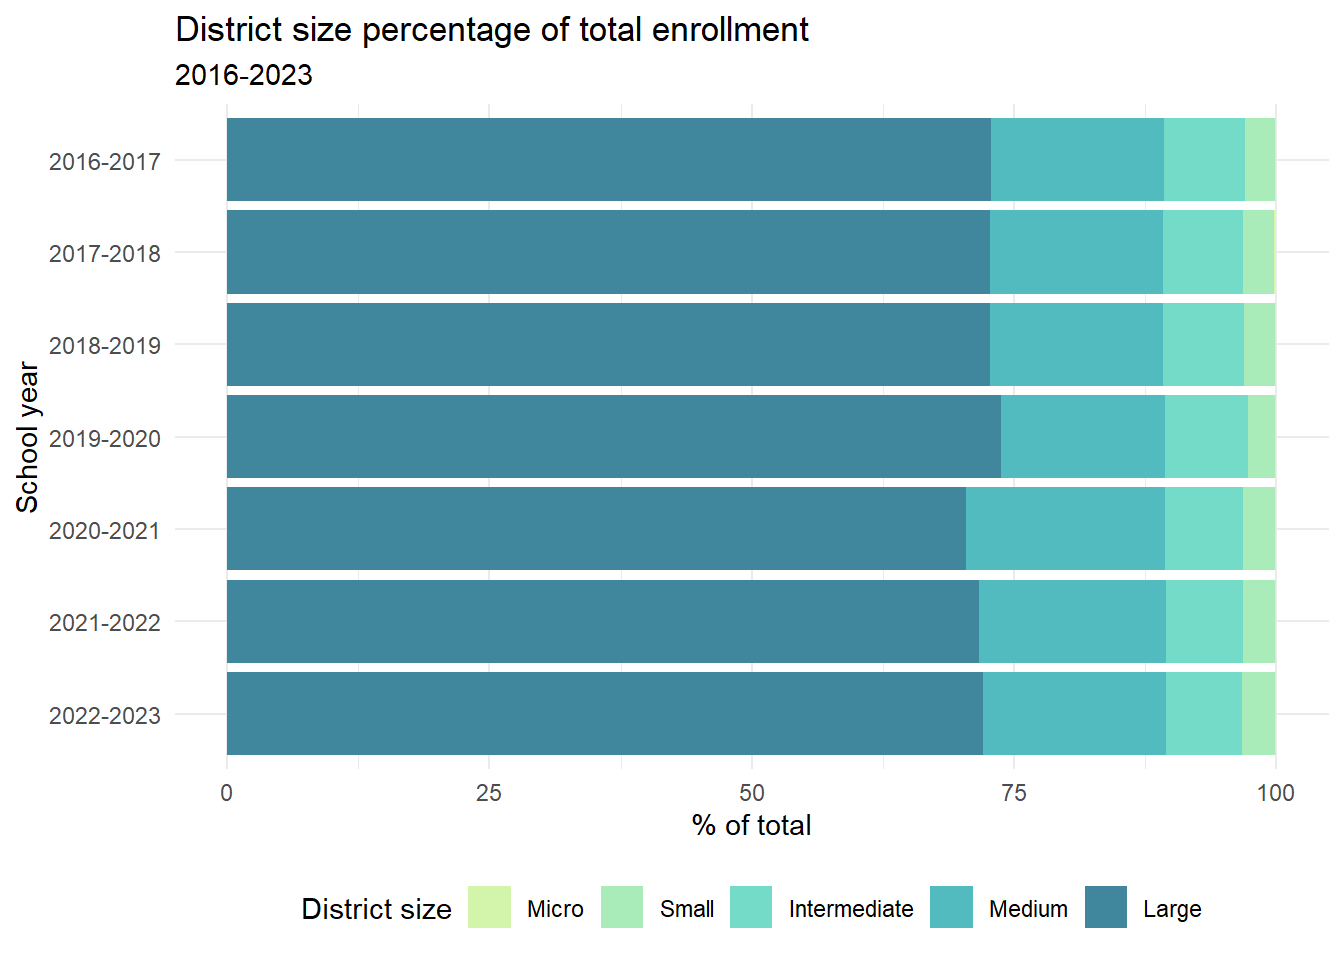
As this graph illustrates, there is a noticeable increase in enrollment in large districts in 2019-2020 followed by a nearly equally pronounced drop the following year. Enrollments are set early in the school year, so the increase in overall enrollment, and large districts’ uptake of more students is independent of the COVID-19 pandemic. The drop in total enrollment and large districts’ relative loss of students the following year may indicate a removal of students from the school system. There is another uptick in enrollment the following year, which aligns with the peak rate of chronic absenteeism observed from 2016 to 2023. It is unclear whether these phenomena are related or not.